Data Visualization

RedBull Dante Exum Infographic
When a basketball phenom from Australia’s performance was off the charts, RedBull asked me to organize and present those charts to grab people’s attention.
Topic research, Data visualization
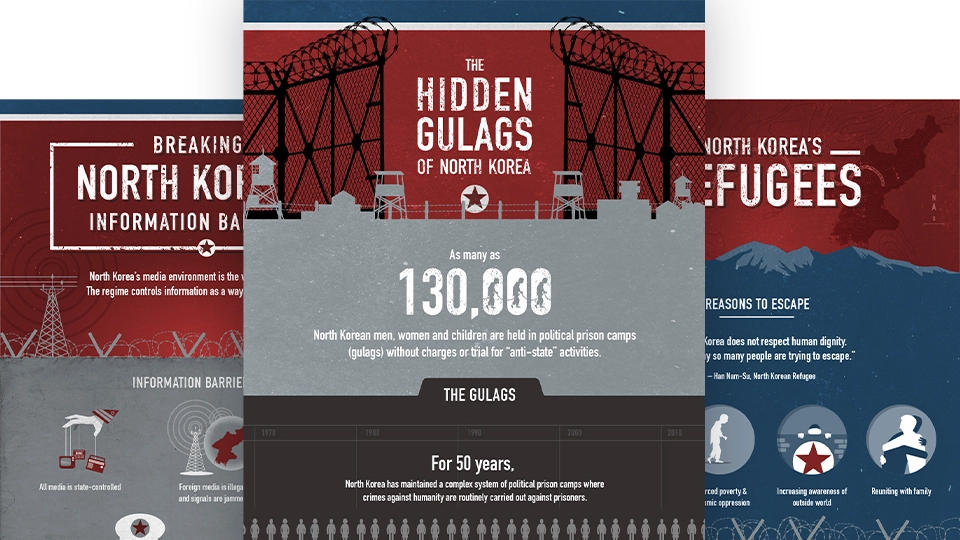
Bush Center North Korea Infographic Series
The humanitarian in me couldn’t turn down a chance to use my skills to spread awareness of atrocities hidden from us in the Korean peninsula.
Topic research, Data visualization, Custom Illustration


BOSCH Automotive Infographics
The automotive wing of this global engineering juggernaut asked me to make diesel rail injectors and oxygen sensors easy to understand and get excited about. No pressure.
Topic research, Data visualization, Custom Illustration
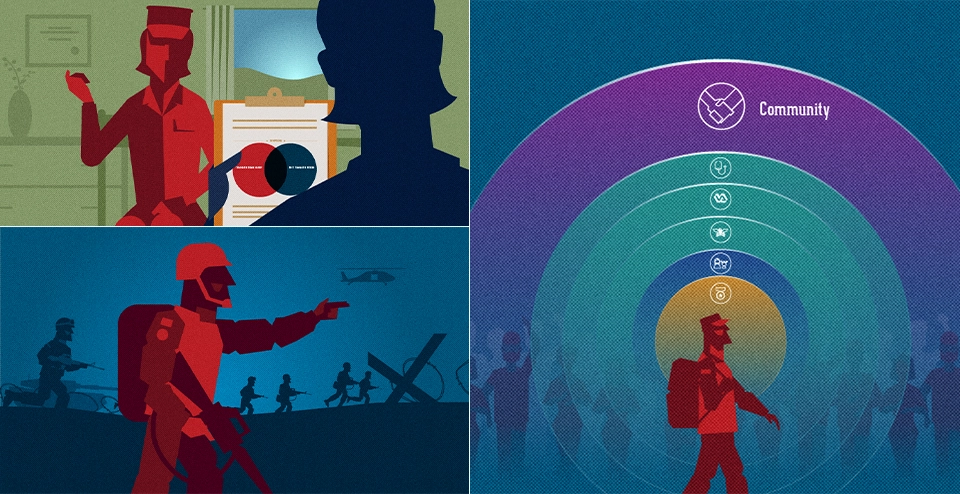
Visualizing Key Healthcare Milestones for Learnvest and Anthem
Turning financial advice into an entertaining scroll for two corporate giants.
Data visualization, Custom Illustration

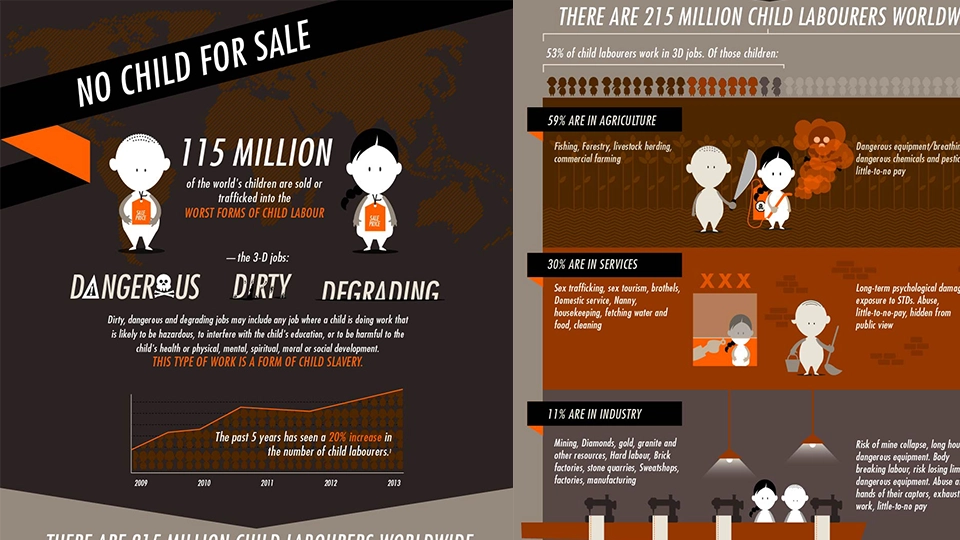
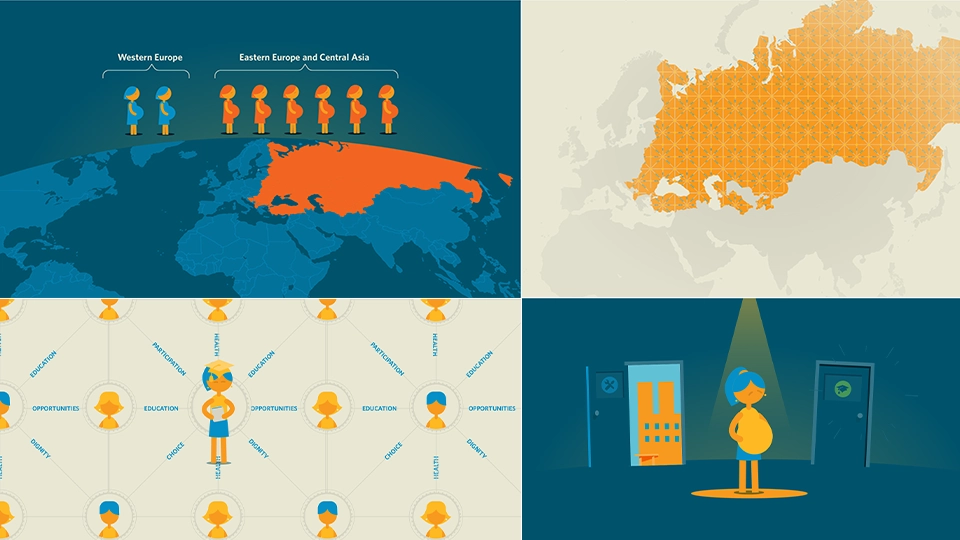
Worldvision “No Child For Sale” Infographics
It’s depressing to visualize with full-color illustrations, charts, and animations the cold, hard facts about child slavery. But it was rewarding when my efforts contributed to the passage of Bill S-211, “The Fighting Against Forced Labour and Child Labour in Supply Chains Act.”
Topic research, Data visualization, Custom Illustration
My Data Visualization Skills in a Nutshell


